The folks at DataStories have done an expert analysis of six popular marketing blogs with more than 100,000 followers. Let us see if we can find some tips to get a viral blog post running, how really does social media influencers affect virality.
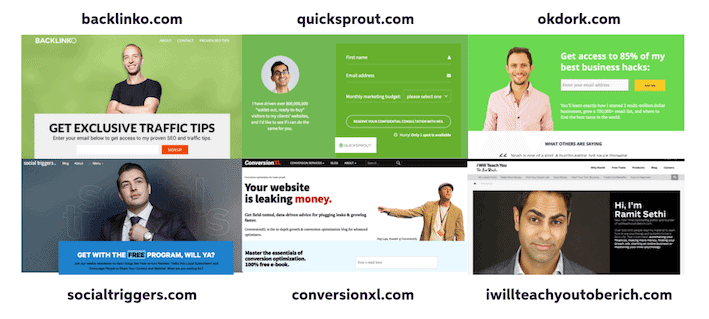
Analysed Social Media Influencers:
- OkDork blog by Noah Kagan,
- Backlinko blog by Brian Dean,
- ConversionXL blog by Peep Laja (no post date and no number of comments),
- IWillTeachYouToBeRich blog by Ramit Sethi (no number of comments),
- Quicksprout blog by Neil Patel,
- SocialTriggers blog by Derek Halpern.
The analysis is done based on 52 metrics about post url, date posted, social share counts, headline, length of headline, and advanced metrics like post neutrality, headline neutrality, etc.
So is there a perfect post recipe obtainable from 6 main marketing & blogging giants?
The analysis is a bit detailed and requires five main sub-sections: Let’s dive into each of them in detail…
- Basic statistics.
- Trends over time.
- Headline analysis.
- Content analytics.
- Sentiment analytics.
Here is a summary of the analysis:
- Consistency is KEY. the magic number is between 1 and 3 posts per week.
- There is no magic day to publish posts. Weekends tend to work worse for social shares than workdays, probably because generally, we chill out on weekends, and avoid professional talks.
- Positive sentiment of the post content and headline, drives most shares for these social media influencers.
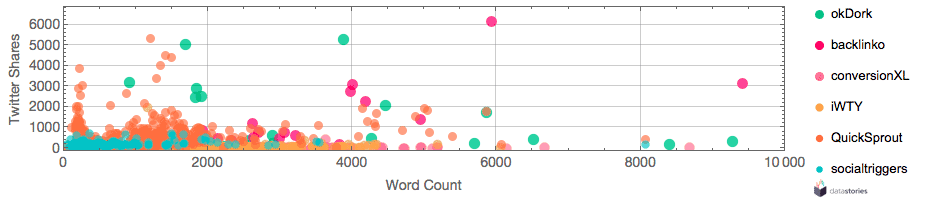
- Optimal post length to maximize tweets is ~4000 words.
- Six distinct post groups emerge from all the posts we analyzed, and two of them have significantly higher number of shares per post. These sections have keywords like traffic, conversion, design, test, etc.
- For small posts of under 1000 words 8 to 10 external links are the optimum. Large posts require at least 50 links to hit the maximum sharing.
The blogging giants have unique content, and hence the popularity is not easy to replicate.
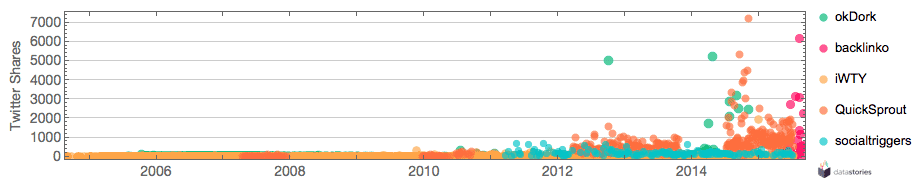
Look at the TWEETS of individual blog posts over time. The social trend has started only after 2010, perhaps because the giants realized better ways to rank their post, and drive more traffic.
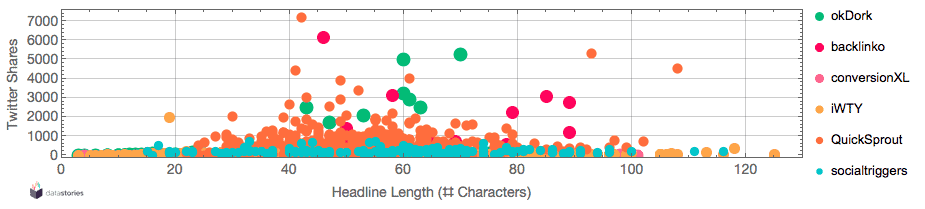
There is a lot of controversy about the ideal post length, day to post or ideal headline length. All possible headline lengths have been tried. Headlines with 40-65 words have high fraction of super-tweets. In micro analysis, different blogs have different preferences, and the high-popularity range of headline lengths is quite wide
Word count varies from blog to blog. Backlinko, OkDork, IWTYTBR like long and super-long posts of more than 2000 words. Social Triggers prefers posts with less than 1000 words, while Quicksprout has specific preferences for either short 250-300 word posts or 1000-2000 words. Personally, I find hard to read posts above 2000 words!
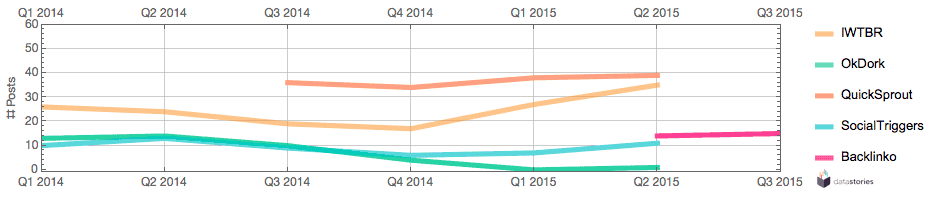
Let’s look at posting evolution for all giants over time
Look at the differences in posting frequency per quarter since 2014. OkDork has been getting quieter since Q3 2014. Quicksprout outputs 35-40 posts per quarter. Ramit Sethi has been ramping up his output significantly since Jan 2015.
Average FACEBOOK SHARES per POST are quite different among the blogs.Note the backlinko which became active in Q2 2015 and quickly got pretty high in avg shares per post:
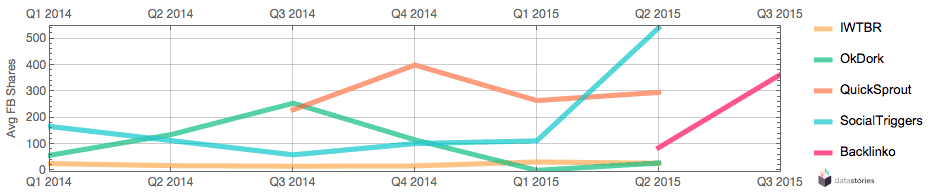
The amazing thing about backlinko is that only 29 posts were analysed, and with six months in active existence the blog gained very impressive social sharing metrics. If shares are the goal, and time is tight, Brian Dean, social media influencer from backlinko, might have a process which falls into the growth hacking category.
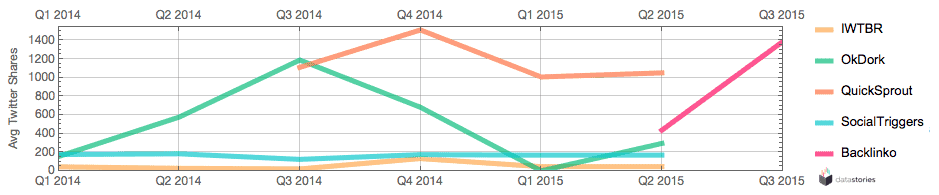
Average TWITTER SHARES per POST show similar trends. Can you guess which blogs have social media shares as their target metrics?
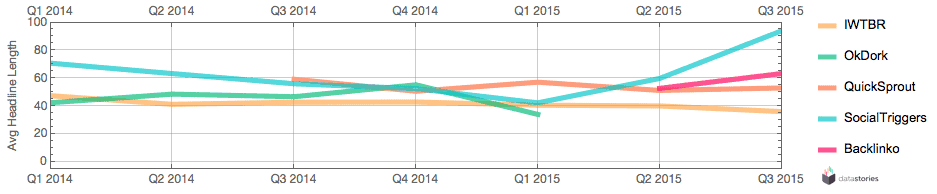
Average HEADLINE LENGTH per POST quite similar for all blogs – something between 40 and 60 characters is a golden range:
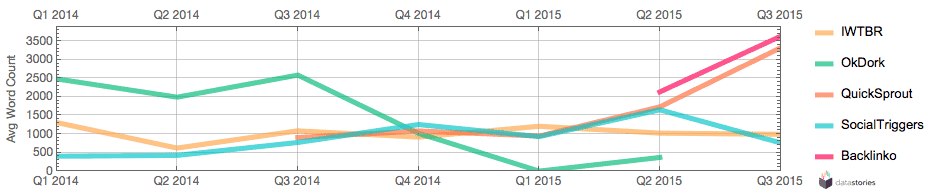
Average WORD COUNT per POST differs a lot. Social Triggers have been ramping it up. Backlinko started writing super-long posts.
To compare the day of posting and social shares – if all 2,831 posts are considered as one pile – the results are inconclusive.
Headlines:
Headline properties like length and neutrality have been appearing as the driving variables in predicting social shares and number of comments on several occasions. You can find the details below. Two main conclusions here:
- Headlines should not be neutral – the heigher neutrality the less social shares and comments.
- Longer posts should have longer headlines. If your headline is short, the post must be short as well, or the social shares will go down.
Content analytics.
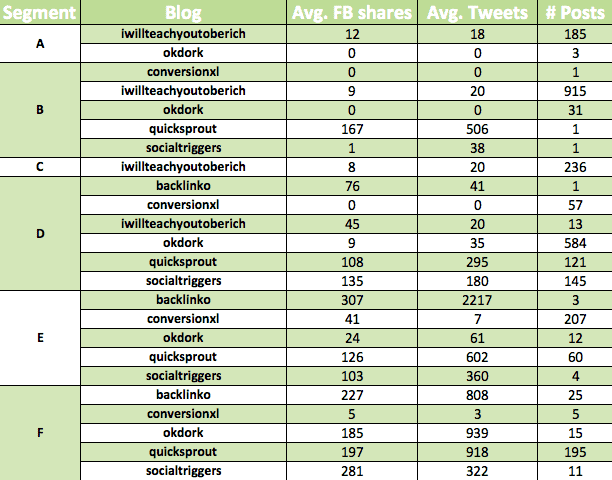
All 2831 posts form five distinct clusters, name them as A,B,C,D,E,F and calculated the average stats for them. The results are interesting!Below are the average number of facebook and twitter shares per content cluster, for each individual blog.
Note, that while for most blogs the social shares increase towards segments E and F, Quicksprout does very well in segment B. Cluster C (represented by words card, calculator, credit, ultimate, banner, otherwise, guide, comment, blog, update, free, get, new, save, money) is entirely monopolised by Ramit Sethi, another social media influencer from IWT.
Neutrality Analysis:
During the sentiment analysis of individual post content and headlines, two sentiment scores are assigned to each post. The post itself can be labeled as positive, negative or neutral, and it’s headline can also be positive, negative, or neutral.
Being neutral, does not help to get social shares. We discovered, that a NEUTRAL headline alone is insufficient predictor of social media sharing. The content of the post itself has to be taken into account!
Posts with NEUTRAL headline & content get shared the WORST, while with POSITIVE headline & content – the BEST of all posts! It pays off to be positive in headlines and content.
Posts with NEUTRAL CONTENT get shared the WORST!
Voila! The data clearly demonstrates that neutrality in your language reduces the chance for your posts to be read and shared. Express an opinion and show personality. Facebook values both extremes. Twitter rewards being positive.
If you are looking for practical tips, check out this post from ExpressText on social media marketing.